By Christopher A. Haines, Biodiversity for a Livable Climate
Christopher Haines is a seasoned architect licensed in both MA and NY who applies expertise in regenerative architectural design, healthy materials, preservation, renovation and specification writing to small commercial and urban projects. He has spoken for years at US and international forums as well as formally teaching sustainability and environmental management to undergraduate and graduate students. Christopher has been deeply involved in the Living Building Challenge and is certified as a Living Building Challenge consultant.
…
The year of 1979 was a critical one for the science of greenhouse gases and climate change. In April, the Jasons, a “mysterious coterie of elite scientists” [Rich 2019:15] published a report “The Long-Term Impact of Atmospheric Carbon Dioxide on Climate.” This report was subsequently reviewed by a National Academy of Science team commissioned by the Carter Administration and led by Jule Charney of Massachusetts Institute of Technology.
With the publication of the “Charney Report,” “Carbon Dioxide and Climate: A Scientific Assessment,” in July of 1979, the science of greenhouse gases as the sole cause of climate disruption was codified and canonized. Climate modeling was later made more sophisticated by the Intergovernmental Panel on Climate Change (IPCC), but the basic structure was not changed. We are thus the recipients of sophisticated modeling of a very complex system based on a single variable with secondary inputs.
We have spent the last 40 years so focused on the “pot lid” being the cause of the pot boiling over that we have failed to consider the possibility of turning down the stove. Climatologists all agree that the atmosphere is warmed by infrared rays radiated from the earth’s surface. Greenhouse gases are so named because they perform like a greenhouse, trapping that heat. But the ‘science’ seems to have overlooked where the heat comes from.
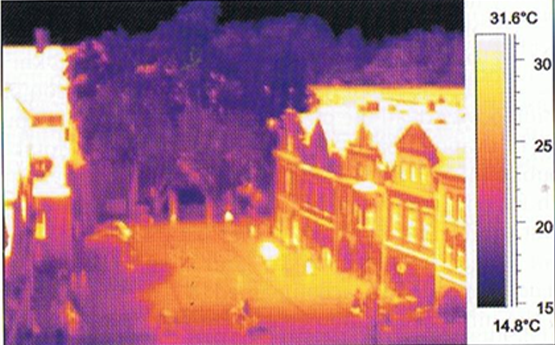
Sunshine is utilized differently depending on the interface it strikes. Living plant tissues promote photosynthesis and transpiration of water, causing cooling, while inanimate materials merely convert solar energy into heat. Everyone knows that walking barefoot on a summer day through a forest or across a meadow, desert or parking lot provide very different thermal experiences, particularly for your feet.
In walking across the desert and parking lot your feet experience sensible heat, the heat you can measure with a thermometer. In walking through the forest you experience latent heat, which is the heat required to convert water into vapor. Since considerable heat energy is spent converting liquid water into vapor (590 calories per gram), that heat does not increase the temperature. This is also the cooling mechanism of sweating. The evaporation of water increases humidity, and is thus experienced as sensible cooling. It’s worth noting that it takes only 80 calories to melt a gram of ice, which illustrates how powerful a cooling agent is the transfer of heat to water vapor (heat of vaporization). These experiences acknowledge different materials in different environments, generating very different temperatures.

Climatologists monitor reflectivity of land surfaces (“albedo”) as a guide to their thermal characteristics. Trees and forests have a reflectivity of between 5% and 20% for different species, and NASA uses an average of 14% for its Earth model. This turns out to be almost exactly the same as brick, concrete or urban areas overall. The question is what happens to the energy that is not reflected. Schneider and Sagan [2005] document energy balances for forests with 15% of energy reflected, 18% turned into heat, 1% turned into biomass and 66% used for transpiration. Yet for brick, concrete or urban areas, the roughly 85% of energy not reflected is turned wholly into heat. Thus albedo is an inaccurate description of the heat generating characteristics of a land surface.
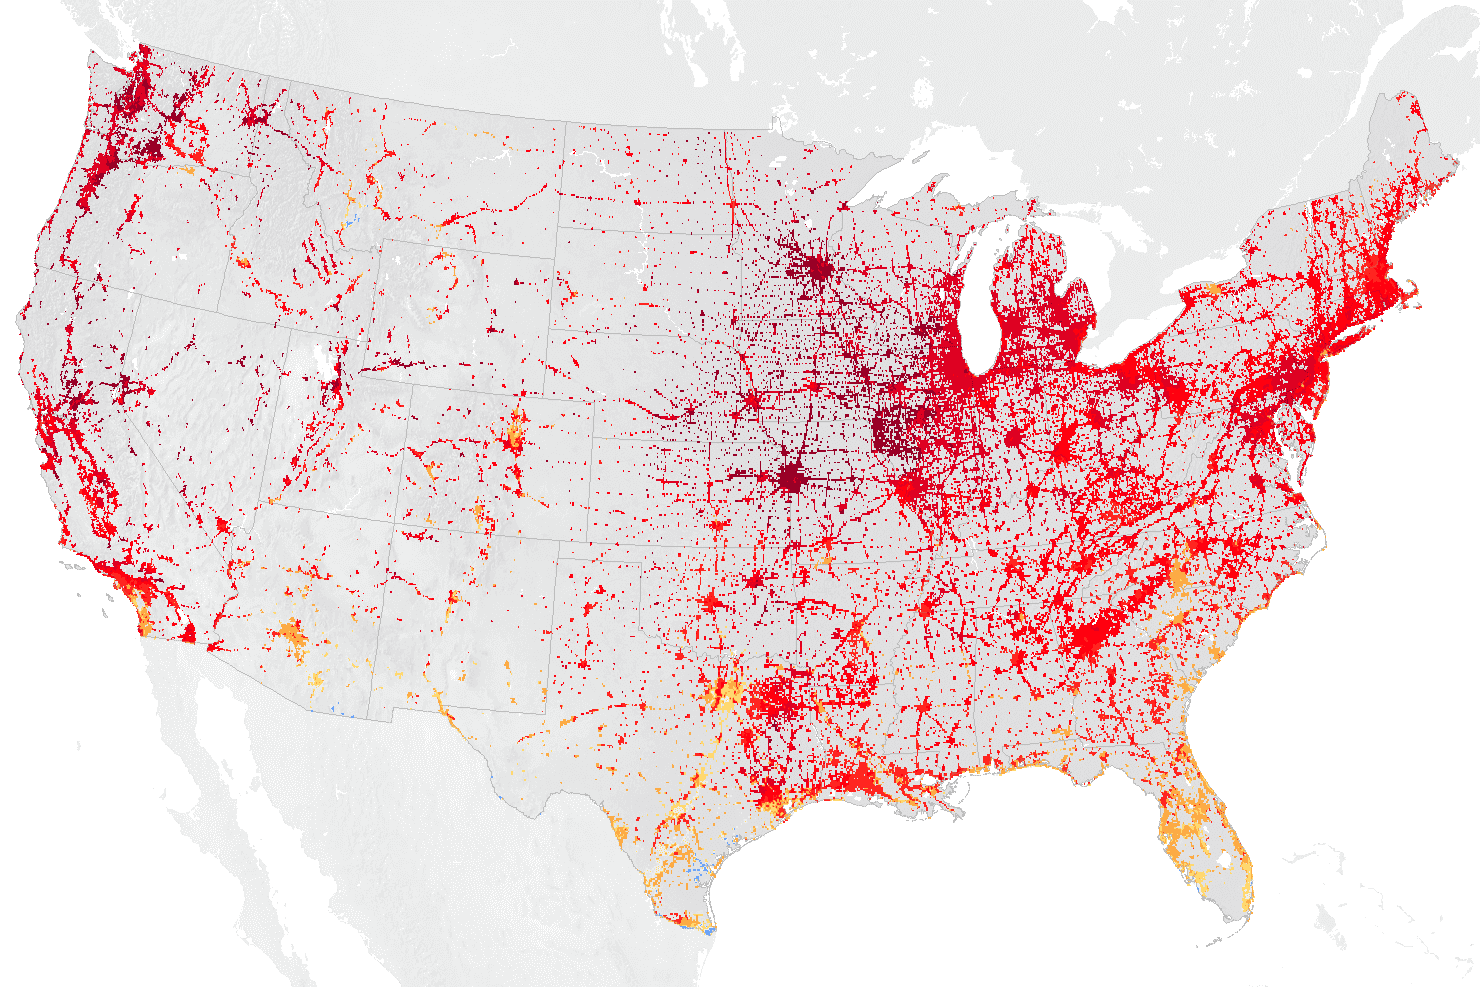
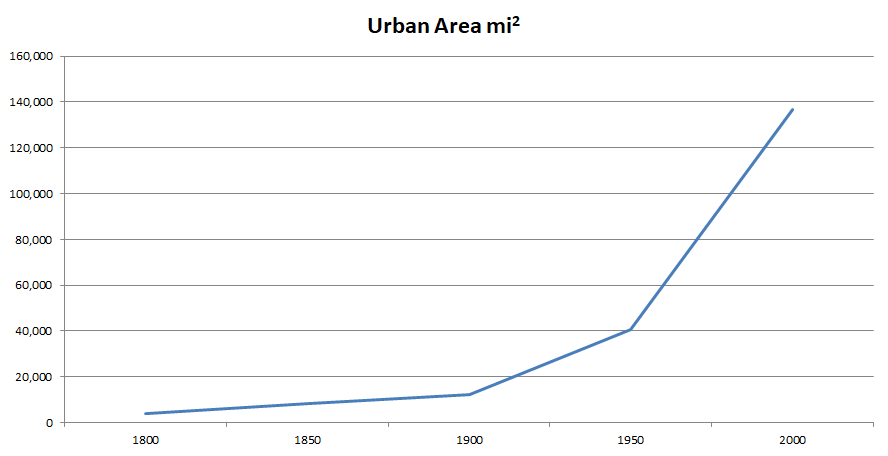
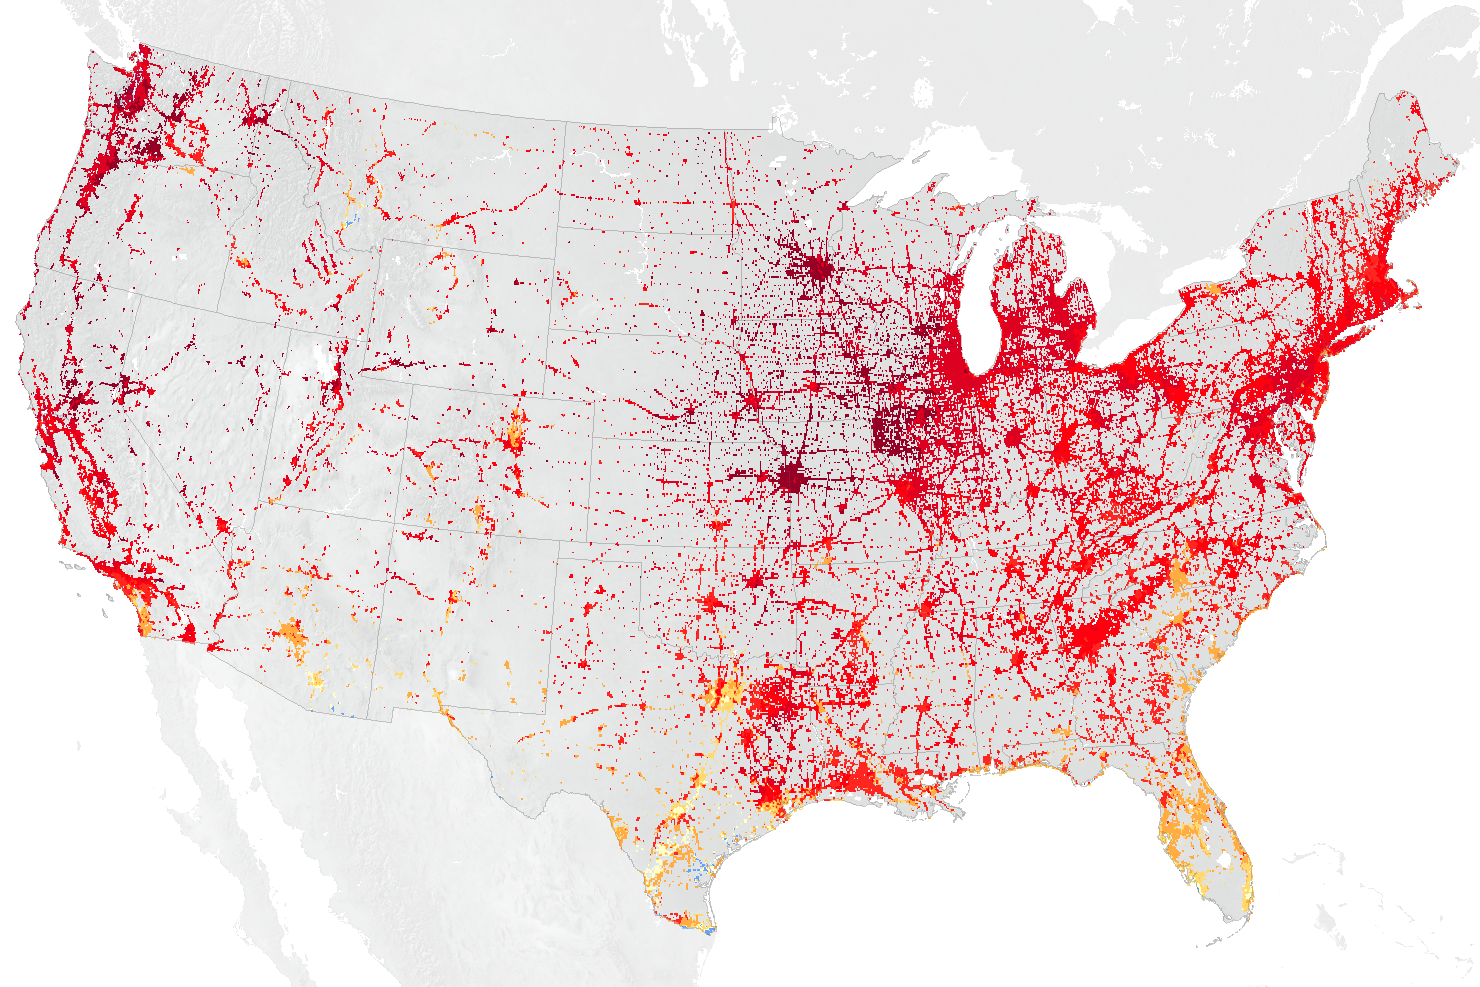
Urban heat islands have been known since Luke Howard published his two-volume thesis on the Climate of London in 1818 and 1820. While we have focused on greenhouse gases that have risen 30.85% from 1800 to 2000, urban land area has increased 3345% and urban population has increased 3836% in the same timeframe.[8] And that is just the footprint. The solar interface – that is, the surface area of urban buildings that the sun strikes – could easily be ten or more times the footprint, even recognizing that some of the buildings’ surfaces remain in shade.
While the physics of urban heat islands were discovered in urban centers where the phenomenon is concentrated, what is critical to recognize is that the same physics apply everywhere. We define urban heat islands as urban centers that are warmer than non-urban areas some distance away. But the sun shines on non-urban areas as well, and any inanimate object – bare soil, a building, or a road – generates heat from insolation. Those non-urban areas are thus warmer than they would otherwise be, and we are underestimating the temperature rise of urban areas because we have no “zero zone” to measure against.

The destruction of biodiversity in any form that reduces leaf surface area, reduces the evapo-transpiration of water, the cooling it produces and the rain it promotes. It also reduces the biomass growth that increases sequestration. Thus biodiversity destruction directly causes a loss of cooling but is also the precursor to the generation of heat from bare ground, deforestation, aridification, open pit mining, mountaintop removal, roadways or the construction of buildings and urban centers. We must therefore recognize that the destruction of biodiversity causes double damage. Is it relevant to note that the IPCC has spent much of its correspondence in the last few decades admitting that it has underestimated the rate at which warming was occurring? Is this because it has failed to account for the rising temperature of the ‘stove’?

In other words, we have created what is effectively a global heat island, caused by solar energy generating sensible heat from the inanimate materials it strikes. Greenhouse gases exacerbate the problem by increasing the percentage of heat trapped, thus increasing the warming effect, but they do not cause the creation of sensible heat from solar energy.
The science of reducing urban heat islands has been known for decades, so we know what has to be done, although we surely need to dig deeper. With this perspective we open a world of opportunities to resolve our current predicament at the level of root causes.
Bare soil in agriculture does not produce as much heat as a roadway or a building, but there is a lot more of it. If all agriculture were converted to regenerative methods, such as practiced by Gabe Brown [2018], we might find that, globally, we have increased cooling and reduced heat generation sufficiently. Even short of a full transition to ecological/regenerative agriculture, a change in practices as simple as reducing fallow (bare) land in the Canadian prairie provinces produced significant improvements in temperature, rainfall, humidity and cooling [Vick 2016].
None of this diminishes the importance of reducing greenhouse gas emissions. However, it means that many other options to reverse climate disruption exist and several of the ones we have focused on may be less effective than others we have not yet considered, or even counterproductive. Perhaps some new balance between ecological regeneration and a reduction in greenhouse emissions will be found that would take us out of the danger zone.
The Heat Planet hypothesis provides a far more hopeful future where climate solutions are largely local and where impacts can be felt almost immediately.
Rich, Nathaniel, 2019, Losing Earth: A Recent History, New York: Farrar, Straus & Giroux, https://www.mcdbooks.com/books/losing-earth.
Vick, Elizabeth S.K., et al., 2016, The surface-atmosphere exchange of carbon dioxide, water, and sensible heat across a dryland wheat-fallow rotation, Agriculture, Ecosystems and Environment 232, https://www.sciencedirect.com/science/article/abs/pii/S0167880916303863.
[8] Figures calculated by author based on data retrieved from: https://ourworldindata.org/urbanization
* US map (above) showing concentrations of impervious surfaces retrieved from: https://earthobservatory.nasa.gov/images/86440/vegetation-limits-city-warming-effects