In a project funded by National Oceanic and Atmospheric Association (NOAA), about two dozen citizen scientists measured temperatures in Baltimore and Washington DC on two of the hottest days of 2018. By measuring temperatures second by second with thermal sensors while driving prescribed routes through each city, the data collectors revealed a 17-degree temperature gap between the coolest and hottest parts of DC on the same day. The difference? Trees. The well-wooded areas of Natural Arboretum and Rock Creek Park were the coolest parts of the city. The results were similar in Baltimore, where the hottest places were neighborhoods covered in concrete and asphalt with little vegetation. These hotspots were 103 degrees, compared to areas with lots of big trees and parks, which were 16 degrees cooler on the same day.
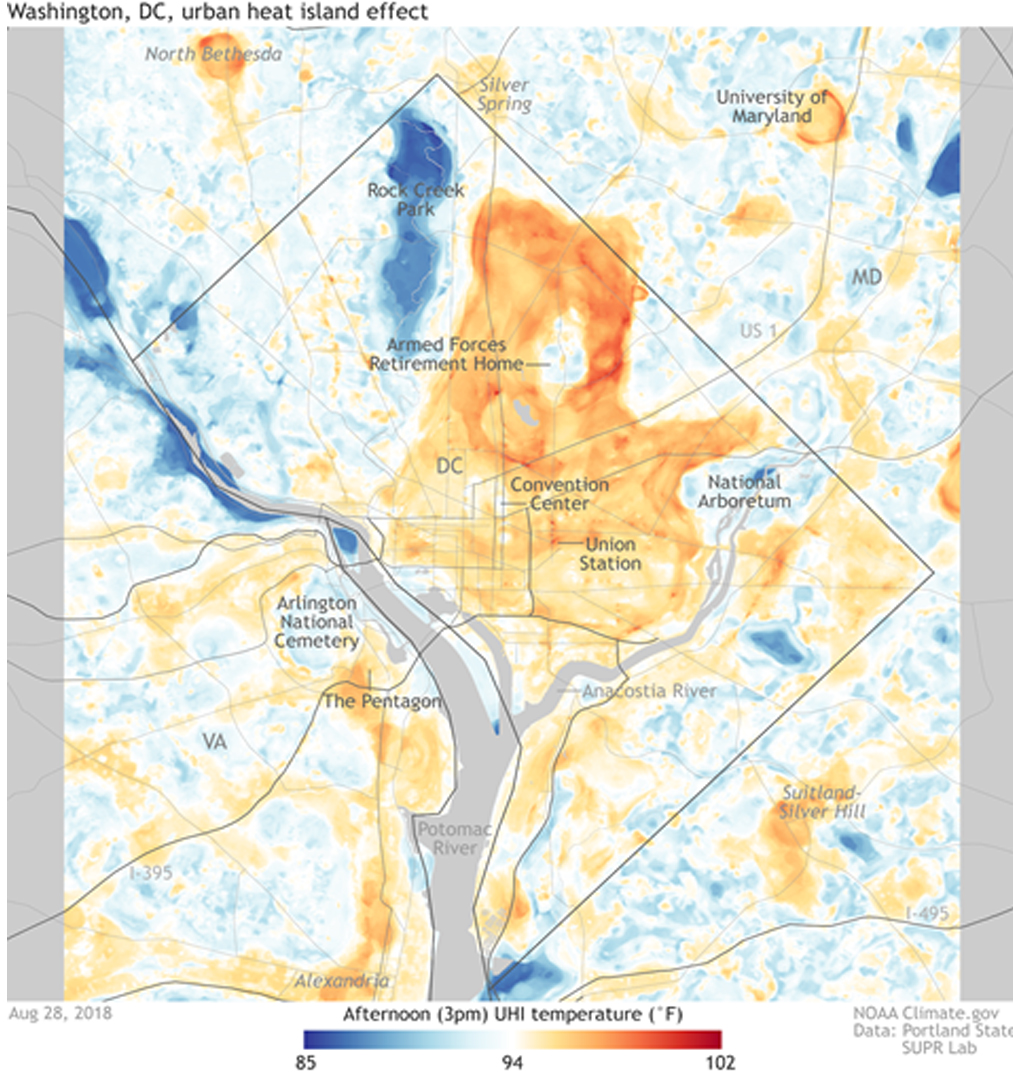
“Major roadways and dense urban pockets are some of the warmest landscapes in both cities” [NOAA 2018], according to Jeremy Hoffman of the Science Museum of Virginia, one of the lead researchers on the study. “These are areas with little or no vegetation, more asphalt and concrete buildings, which can amplify a heat wave” [NOAA 2018].
Researchers used the data to create heat maps of both cities, which can pinpoint the neighborhoods most vulnerable to dangerous heat waves, and to help city officials identify cooling and resiliency strategies, namely bolstering the quantity and quality of green space, planting new trees and protecting existing trees.
NOAA (National Oceanic and Atmospheric Administration), 2018, Hot days in the city? It’s all about location, https://www.noaa.gov/news/hot-days-in-city-it-s-all-about-location.